Saturday, October 10, 2026

From Fresh Install to Dev Beast: Optimizing Ubuntu 26.04 LTS for Web, Mobile Development

Ubuntu 26.04 LTS Flutter & Mobile Dev Linux Optimization ZRAM & Btrfs

When you do a fresh install of a Long Term Support (LTS) Linux distribution, you generally expect a clean slate ready for work. But default desktop installations—even minimal ones—ship with latent performance drains: kernel crash dump reservations, background telemetry daemons, disk indexers that thrash during builds, low file watcher ceilings, and uncompressed root partitions.

In this guide, we take a brand new install of Ubuntu 26.04.1 LTS (Resolute Raccoon) on an AMD Ryzen 5 7520U laptop and tune it to peak responsiveness for Web and Mobile App Development.

1. The Initial Audit: 8 Hidden Bottlenecks Uncovered

A rigorous audit using system profiling tools revealed several key inefficiencies out of the box:

⚠️ 512 MB Physical RAM Locked

kdump-tools reserved 512 MB of physical RAM via crashkernel command line arguments purely to record hypothetical kernel panics.

⚠️ Intel Thermald on AMD CPU

thermald was active and repeatedly failing with "Unsupported cpu model or platform" on our AMD Zen 2 CPU.

⚠️ LocalSearch / Tracker Indexer

localsearch-3 was crawling disk files, consuming CPU and I/O cycles that belong to active code builds.

⚠️ 1.2 GB Hoarded in Old Snaps

Snap retained multiple obsolete disabled revisions of core runtimes and Firefox.

⚠️ Low Watcher Limit (65,536)

Guaranteed ENOSPC failure when launching Flutter, Vite, or Next.js hot-reload watchers across large codebases.

⚠️ Uncompressed Btrfs /home

/home on Btrfs was mounted with default uncompressed options, missing out on massive storage savings for node_modules and SDKs.

2. Stripping Bloatware & Reclaiming RAM

First, we reclaimed the 512 MB physical memory allocation by purging Kdump and Intel Thermald, and updating GRUB:

# Purge kdump-tools and incompatible Intel thermald
sudo apt-get purge -y kdump-tools thermald
sudo rm -f /etc/default/grub.d/kdump-tools.cfg
sudo update-grub
sudo apt-get autoremove --purge -y

Next, we eliminated background crash reporting and stopped printing daemons (retaining Bluetooth for wireless headsets and input devices):

# Disable crash telemetry
sudo sed -i 's/enabled=1/enabled=0/g' /etc/default/apport
sudo systemctl mask apport apport-autoreport.service apport-autoreport.timer whoopsie.service whoopsie.path

# Disable CUPS print daemons & unneeded hardware listeners
sudo systemctl mask cups cups-browsed cups.socket cups.path ModemManager spice-vdagent
sudo touch /etc/cloud/cloud-init.disabled
sudo systemctl mask cloud-init cloud-init-local cloud-config cloud-final

# Silence file indexing for the developer account
systemctl --user mask localsearch-3.service localsearch-control-3.service localsearch-writeback-3.service

3. Memory & Storage Architecture: ZRAM & Btrfs

Heavy builds in Android Gradle and Node.js can easily consume gigabytes of memory. Swapping to physical SSD blocks causes latency, UI stutter, and SSD write endurance wear.

The Dual-Tier Swap Strategy

We deployed systemd-zram-generator configured with Zstandard (zstd) compression at Priority 100, while keeping the 22.9 GB SSD swap partition as fallback at Priority 10.

Configure /etc/systemd/zram-generator.conf:

[zram0]
zram-size = ram / 2
compression-algorithm = zstd
swap-priority = 100

Running zramctl confirms real-world compression:

NAME       ALGORITHM DISKSIZE  DATA COMPR TOTAL STREAMS MOUNTPOINT
/dev/zram0 zstd          7.2G  632K 56.6K  396K         [SWAP]

Memory pages are compressing at over an 11:1 ratio with near-instant CPU decompression.

Transparent Btrfs Compression

In /etc/fstab, we appended compress=zstd:1 to the /home mount options. All subsequent files (repos, packages, Android SDK builds) are automatically compressed before hitting flash storage, yielding 30–50% space savings.

4. Linux Kernel Tuning for Developers

We applied targeted kernel parameters in /etc/sysctl.d/99-dev-optimization.conf:

# File watchers for Node, Next.js, Vite, Gradle, & Flutter
fs.inotify.max_user_watches = 1048576
fs.inotify.max_user_instances = 1024

# System-wide file descriptors
fs.file-max = 2097152

# Virtual Memory tuning for ZRAM
vm.swappiness = 100
vm.vfs_cache_pressure = 50
vm.dirty_ratio = 10
vm.dirty_background_ratio = 5

5. Full Web & Mobile Development Stack Setup

With system tuning complete, we equipped the full developer toolchain:

Core & Web Development

Installed Node.js 22 LTS, npm 9.2, and pnpm 12.10. Added Docker Engine 29.1 with Compose plugin, configuring non-root access by adding the developer to the docker group.

Mobile & Android Acceleration

Configured OpenJDK 21, added the user to the kvm group for Android Emulator hardware acceleration, and deployed Android SDK 36 with upstream command-line tools.

Flutter 3.47 Stable & Google Chrome

Deployed Flutter SDK (stable branch) in ~/development/flutter and installed native Google Chrome Stable for direct web app target debugging.

The Result: Zero-Warning Flutter Doctor

Doctor summary (to see all details, run flutter doctor -v):
[✓] Flutter (Channel stable, 3.47.7, on Ubuntu 26.04.1 LTS 7.0.0-38-generic)
[✓] Android toolchain - develop for Android devices (Android SDK version 36.0.0)
[✓] Chrome - develop for the web
[✓] Linux toolchain - develop for Linux desktop
[✓] Connected device (2 available)
[✓] Network resources

• No issues found!

6. Before vs. After Optimization Matrix

Component Stock Ubuntu 26.04 Optimized State
Physical RAM for Kdump 512 MB reserved 0 MB (Reclaimed for OS)
In-Memory Swap (ZRAM) None (0 GB) 7.2 GB zstd (Priority 100)
/home Storage Uncompressed Transparent Btrfs zstd:1
Inotify Watchers 65,536 1,048,576
Background Telemetry Apport, Whoopsie active Completely Masked
Android KVM Acceleration Permission denied Hardware KVM Active
Systemd Failed Units apport-autoreport failed 0 failed units

Final Thoughts

With background bloat eliminated, memory swapping secured in high-speed RAM, disk writes transparently compressed, and modern developer toolchains verified without a single warning, this host is primed for building next-generation web and mobile applications with Antigravity and Google Gemini AI.

How to Create Launchers for Google Antigravity and Antigravity IDE in Ubuntu

If you are developing with Google’s new agentic AI ecosystem on Linux, you have likely explored both Google Antigravity (the standalone desktop application powered by Electron) and Google Antigravity IDE (the AI-first IDE built on VS Code).

Unlike standard .deb packages or Snap store installations, the Linux distributions are provided as standalone tar archives that you extract directly into your user home folder (e.g., ~/GoogleAntigravity/). While you can run them directly from terminal commands or the file manager, they lack native desktop integration out of the box:

  • They do not appear in the Ubuntu Application Overview / Dash.
  • They do not have distinct, high-res application icons in the Ubuntu Dock.
  • GNOME Shell might show a generic gear icon or unlinked window when they run.
  • Desktop shortcuts may show a generic text icon and refuse to launch due to untrusted metadata.
  • Worst of all: launching either binary for the first time often crashes immediately with a cryptic chrome-sandbox permissions error!

In this tutorial, we will walk through the entire setup: downloading the packages, fixing the critical chrome-sandbox issue step-by-step, and creating FreeDesktop-compliant desktop launchers and icons on Ubuntu (including 24.04 and 26.04 LTS).


1. Downloading & Extracting Antigravity

Before creating the launchers, obtain the latest Linux packages from the official portal:

1. Download Packages:

  • Head over to https://antigravity.google and download:
    • Google Antigravity (Antigravity.tar.gz) — Standalone Agent desktop app.
    • Google Antigravity IDE (Antigravity IDE.tar.gz) — VS Code-based agentic IDE.
  • Grab the official high-resolution branding logo (Google-Antigravity-Icon-Full-Color.png) from the branding assets or documentation resources.

2. Extract to Your Directory:

Create a dedicated folder in your home directory and extract the tar archives:

mkdir -p ~/GoogleAntigravity
cd ~/GoogleAntigravity

# Extract Antigravity (App)
tar -xzf ~/Downloads/Antigravity.tar.gz

# Extract Antigravity IDE
tar -xzf ~/Downloads/"Antigravity IDE.tar.gz"

This creates two working directories:

  • ~/GoogleAntigravity/Antigravity/Antigravity-x64/
  • ~/GoogleAntigravity/AntigravityIDE/

2. The Critical Step Most People Miss: Configuring chrome-sandbox

This is the #1 pitfall where many developers get stuck, frustrated, and give up.

The Fatal Error

If you try to launch either application immediately after extraction:

~/GoogleAntigravity/Antigravity/Antigravity-x64/antigravity

You will likely encounter this abort message:

[ERROR:zygote_host_impl_linux.cc] The SUID sandbox helper binary was found, but is not configured correctly. Rather than run without sandboxing I'm aborting now. You need to make sure that chrome-sandbox is owned by root and has mode 4755.

Why Does This Happen?

Both applications are built on the Chromium/Electron runtime. For process isolation and security, Chromium requires a privileged helper called chrome-sandbox. Because the archive was extracted as a regular user, chrome-sandbox belongs to your normal user account and lacks the SUID (Set User ID) permission. Without root ownership and 4755 permissions, Chromium cannot isolate its renderer processes and halts immediately.

Caution: Do not resort to running with --no-sandbox. While it bypasses the error, it disables Chromium's sandboxing defenses entirely. The clean, safe fix is configuring the sandbox binary properly.

Step-by-Step Fix

Run the following commands in your terminal to grant proper ownership and permissions to the sandbox helpers in both applications:

For Google Antigravity (App):

sudo chown root:root ~/GoogleAntigravity/Antigravity/Antigravity-x64/chrome-sandbox
sudo chmod 4755 ~/GoogleAntigravity/Antigravity/Antigravity-x64/chrome-sandbox

For Google Antigravity IDE:

sudo chown root:root ~/GoogleAntigravity/AntigravityIDE/chrome-sandbox
sudo chmod 4755 ~/GoogleAntigravity/AntigravityIDE/chrome-sandbox

Verify Permissions:

ls -l ~/GoogleAntigravity/Antigravity/Antigravity-x64/chrome-sandbox ~/GoogleAntigravity/AntigravityIDE/chrome-sandbox

Both should display -rwsr-xr-x with root root ownership:

-rwsr-xr-x 1 root root 15232 ... Antigravity-x64/chrome-sandbox
-rwsr-xr-x 1 root root 15328 ... AntigravityIDE/chrome-sandbox

Notice the s in -rwsr-xr-x — this confirms the SUID bit is properly active!


3. Overview of the Two Flavors

Now that both binaries run smoothly, note the key differences between them:

  1. Google Antigravity (App)
    • Binary: ~/GoogleAntigravity/Antigravity/Antigravity-x64/antigravity
    • Role: Standalone desktop app for orchestrating background agents, conversations, and workflows.
    • WM Class / Wayland App ID: antigravity
    • Icon: Multi-color gradient crest (Google-Antigravity-Icon-Full-Color.png).
  2. Google Antigravity IDE
    • Binary: ~/GoogleAntigravity/AntigravityIDE/antigravity-ide (or launcher script bin/antigravity-ide)
    • Role: AI-first coding IDE with code lenses, inline autocomplete, and workspace agent features.
    • WM Class / Wayland App ID: antigravity-ide
    • Icon: Dedicated dark code-grid icon located at resources/app/resources/linux/code.png.

4. Setting Up Application Icons

Ubuntu adheres to the XDG icon specification. Placing your icons in ~/.local/share/icons/ makes them globally accessible to your user session without requiring root privileges.

1. Create the local icon directory:

mkdir -p ~/.local/share/icons/hicolor/512x512/apps

2. Set up the Antigravity App Icon:

Copy your downloaded high-resolution brand asset:

cp ~/Downloads/Google-Antigravity-Icon-Full-Color.png ~/.local/share/icons/antigravity.png
cp ~/Downloads/Google-Antigravity-Icon-Full-Color.png ~/.local/share/icons/hicolor/512x512/apps/antigravity.png

3. Set up the Antigravity IDE Icon:

The IDE already ships with its dedicated dark code-grid icon bundled directly within its package:

cp ~/GoogleAntigravity/AntigravityIDE/resources/app/resources/linux/code.png ~/.local/share/icons/antigravity-ide.png
cp ~/GoogleAntigravity/AntigravityIDE/resources/app/resources/linux/code.png ~/.local/share/icons/hicolor/512x512/apps/antigravity-ide.png

5. Creating the Desktop Launchers

Placing .desktop files in ~/.local/share/applications/ automatically registers them in GNOME Shell, the Application menu, and the Ubuntu Dock.

1. Launcher for Google Antigravity (Desktop App):

Create ~/.local/share/applications/antigravity.desktop:

[Desktop Entry]
Version=1.0
Type=Application
Name=Google Antigravity
GenericName=AI Development Environment
Comment=Google Antigravity - Agentic AI Development Platform
Exec=/home/crysanthus/GoogleAntigravity/Antigravity/Antigravity-x64/antigravity %U
Icon=/home/crysanthus/.local/share/icons/antigravity.png
Path=/home/crysanthus/GoogleAntigravity/Antigravity/Antigravity-x64
Terminal=false
StartupNotify=true
StartupWMClass=antigravity
Categories=Development;
Keywords=Google;Antigravity;AI;Agent;Gemini;Code;
MimeType=x-scheme-handler/antigravity;
Why StartupWMClass matters: On GNOME Shell (both Wayland and X11), StartupWMClass binds the running process window to the launcher. Without this property, clicking the dock icon launches the window, but GNOME treats the running window as a separate unknown application with a generic icon.

2. Launcher for Google Antigravity IDE:

Create ~/.local/share/applications/antigravity-ide.desktop:

[Desktop Entry]
Version=1.0
Type=Application
Name=Google Antigravity IDE
GenericName=Code Editor
Comment=Antigravity IDE - AI-first Integrated Development Environment
Exec=/home/crysanthus/GoogleAntigravity/AntigravityIDE/antigravity-ide %F
Icon=/home/crysanthus/GoogleAntigravity/AntigravityIDE/resources/app/resources/linux/code.png
Path=/home/crysanthus/GoogleAntigravity/AntigravityIDE
Terminal=false
StartupNotify=true
StartupWMClass=antigravity-ide
Categories=Development;
MimeType=text/plain;inode/directory;
Keywords=google;antigravity;ide;editor;code;development;
Actions=new-empty-window;

[Desktop Action new-empty-window]
Name=New Empty Window
Exec=/home/crysanthus/GoogleAntigravity/AntigravityIDE/antigravity-ide --new-window %F
Icon=/home/crysanthus/GoogleAntigravity/AntigravityIDE/resources/app/resources/linux/code.png

6. Desktop Shortcuts & Trusting Them

To place shortcuts on your desktop canvas (~/Desktop):

cp ~/.local/share/applications/antigravity.desktop ~/Desktop/
cp ~/.local/share/applications/antigravity-ide.desktop ~/Desktop/
chmod +x ~/.local/share/applications/antigravity*.desktop
chmod +x ~/Desktop/antigravity*.desktop

Modern Ubuntu uses the Desktop Icons NG (DING) extension. Desktop shortcuts are untrusted until marked:

gio set ~/Desktop/antigravity.desktop metadata::trusted true
gio set ~/Desktop/antigravity-ide.desktop metadata::trusted true

(Alternatively, right-click each desktop icon and select "Allow Launching").


7. Updating Caches and Pinning to Dock

Refresh the application database and icon caches:

update-desktop-database ~/.local/share/applications
gtk-update-icon-cache -f ~/.local/share/icons/hicolor 2>/dev/null

You can pin them to the Ubuntu Dock either by searching in Activities and clicking "Pin to Dash", or from the terminal:

python3 -c "import subprocess, ast; favs = ast.literal_eval(subprocess.check_output(['gsettings', 'get', 'org.gnome.shell', 'favorite-apps'], text=True).strip()); [favs.append(a) for a in ['antigravity.desktop', 'antigravity-ide.desktop'] if a not in favs]; subprocess.run(['gsettings', 'set', 'org.gnome.shell', 'favorite-apps', str(favs).replace('"', '\'')])"

8. Bonus: Command-Line Symlinks

To launch either application straight from your terminal or scripts, add symlinks in ~/.local/bin/:

mkdir -p ~/.local/bin
ln -sf ~/GoogleAntigravity/Antigravity/Antigravity-x64/antigravity ~/.local/bin/antigravity
ln -sf ~/GoogleAntigravity/AntigravityIDE/bin/antigravity-ide ~/.local/bin/antigravity-ide

Now you can open any repository or project folder directly:

antigravity-ide ~/projects/my-awesome-agent

Conclusion

With these steps, you avoid the frustrating chrome-sandbox permission block and ensure both Google Antigravity and Antigravity IDE integrate seamlessly into Ubuntu with native dock grouping, crisp high-DPI icons, desktop launching, and CLI shortcuts. Happy coding with AI agents!

Thursday, November 28, 2024

Building an Intelligent Calculator with Ollama: A Guide to Function Injection in LLMs

In this blog post, I explore how to create an intelligent calculator by leveraging Ollama's API and function injection capabilities. This implementation showcases how Large Language Models (LLMs) can be enhanced with custom functions to perform specific tasks.

Overview

The code demonstrates a practical example of how to inject user-defined functions into an LLM, allowing it to understand natural language queries and execute appropriate mathematical operations. The implementation uses Ollama, a powerful framework for running large language models locally.

Key Components

1. Required Setup

A local Ollama server must be running https://ollama.com

Please refer to the Ollama documentation for setup instructions

The code supports multiple LLM options including:

llama3.2

llama3.1

qwen2.5-coder (used in this example)

Please refer to the Ollama documentation for details on how to set up different LLMs. https://ollama.com/search


2. Core Mathematical Functions

The code implements four basic mathematical operations:

for example,

def add_two_numbers(a: int, b: int) -> int:
"""
Adds two numbers together.
Args:
a (int): The first number.
b (int): The second number.
Returns:
int: The sum of the two numbers.
"""
return a + b

Using the same principle the following functions can be created:

- add_two_numbers(a, b)

- subtract_two_numbers(a, b)

- multiply_two_numbers(a, b)

- divide_two_numbers(a, b)

Each function is well-documented with proper type hints and docstrings, making the code maintainable and self-explanatory.


3. Function Registry

The available functions are stored in a dictionary for easy access:

available_functions = {
"add_two_numbers": add_two_numbers,
"subtract_two_numbers": subtract_two_numbers,
"multiply_two_numbers": multiply_two_numbers,
"divide_two_numbers": divide_two_numbers,
}

4. Interactive Chat Loop

The program runs in an interactive loop where:

Users can input mathematical questions in natural language

The LLM interprets the question and selects the appropriate function

The selected function is executed with the parsed parameters

Results are displayed to the user


Usage Examples

The calculator can understand various forms of input:

"What is 1 + 1?"
"Add 1 and 1"
"1 plus 1"
"one plus one"

This flexibility in input processing demonstrates the power of using LLMs for natural language understanding.


Technical Implementation Details

The core of the implementation uses Ollama's chat API with function injection:

response = ollama.chat(
LLM_TO_USE,
messages=[
{"role": "user", "content": prompt}
],
tools=[add_two_numbers, subtract_two_numbers, multiply_two_numbers, divide_two_numbers],
)

The LLM processes the user's input and determines which function to call along with the appropriate arguments. The program then executes the function and displays the result.


Benefits and Applications

This implementation demonstrates several key concepts:

Function Injection: How to extend LLM capabilities with custom functions

Natural Language Processing: Converting human language to programmatic function calls

Error Handling: Graceful handling of undefined functions and invalid inputs

User Interface: Simple but effective interactive interface

Conclusion

This code serves as an excellent example of how to combine LLMs with custom functions to create practical applications. While this implementation focuses on basic arithmetic, the same pattern can be applied to more complex use cases, from data analysis to automation tasks.


The code is particularly valuable for developers looking to:
Understand function injection in LLMs
Build natural language interfaces for their applications
Learn about integrating Ollama into their projects
This implementation showcases the power of combining traditional programming with LLMs to create more intuitive and flexible user interfaces for computational tasks.

Full code is here,

https://github.com/crysanthus/llm-with-tools.git


Thursday, May 14, 2020

Text File Word Count and Simple Statistics

This Python program is to process given text file and display some interesting and simple statistics.

I've been using Python 3.8.2
Dependencies - pandas and matplotlib.pyplot

This program can read a huge text file and count number of unique words and their occurrences and create a pie chart with the top word list.  The created pie chart is saved to a file.

Text files used here are downloaded from,
https://www.gutenberg.org/wiki/Main_Page

 1
 2
 3
 4
 5
 6
 7
 8
 9
10
11
12
13
14
15
16
17
18
19
20
21
22
23
24
25
26
27
28
29
30
31
32
33
34
35
36
37
38
39
40
41
42
43
44
45
46
47
48
49
50
51
52
53
54
55
56
57
58
59
60
61
62
63
64
65
66
67
68
69
#!/usr/bin/python
# -*- coding: utf-8 -*-

# text file word count, simple stats and graphs
# crysanthus@gmail.com
# 15/5/2020

import pandas as pd
import matplotlib.pyplot as plt


# some global vars
text_file_path = '../db/Bible-KJV.txt'  # https://www.gutenberg.org/ebooks/10.txt.utf-8
title = text_file_path[(text_file_path.rfind('/')+1):-4]  # only the file name without ext 
graph_file_path = f'../graphs/{title}.png'
top_words = 30


# function to read text file and create graph
def text_count_graph_by_word():

    word_list = {}
    nos_words = 0
    nos_unique_words = 0

    # open text file
    fp = open(text_file_path, 'r')
    for line in fp:

        tmp_words = line.split(' ')

        for w in tmp_words:

            # remove all the unwanted chars. Keep the words
            w = "".join(c for c in w if c.isalpha()).lower().strip()
            if w in ['\n', '']:
                continue

            # create word list
            if w in word_list:
                word_list[w] += 1
                nos_words += 1
                continue

            word_list[w] = 1
            nos_unique_words += 1

    fp.close()

    # create a Pandas df using dict
    df = pd.DataFrame.from_dict(word_list, orient='index', columns=['word count'])

    # sort df and get only the top words
    df = df.sort_values('word count', ascending=False)[:top_words]

    # create the pir chart/graph
    fig = df.plot.pie(y='word count', figsize=(8, 8), legend=None)
    fig.set_ylabel('')  # remove left side label

    plt.suptitle(f'{title} - Top {top_words} word occurrence')
    plt.title(f'{nos_words} Total words - {nos_unique_words} Unique words', fontsize=8)

    plt.savefig(graph_file_path)

    plt.clf()


if __name__ == '__main__':
    text_count_graph_by_word()

The result are,

Bible king James version 

Pride and Prejudice,

War and Peace,

Tuesday, July 16, 2019

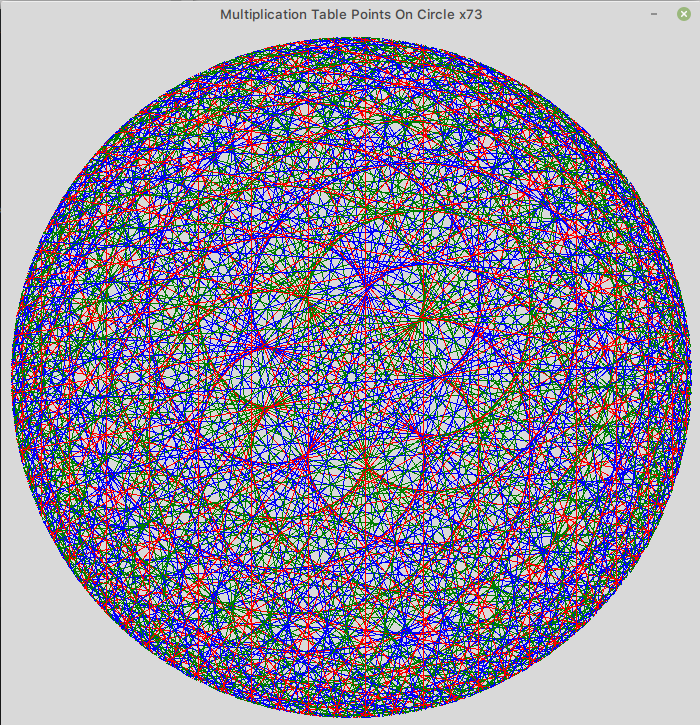
Python Fun - Multiplication Table Points on Circle

... some holiday programming fun ...


... the idea from this YouTube video 

Connect points on a circle based on the multiplication table. It generate various fun patterns. Mathematically these patterns have good meaning in nature. It was a fun exercise to do on a holiday ...

Requirements -
  1. python
  2. Tkinter for python
  3. graphics.py module

Program

#!/usr/bin/python

# Multiplication table on points of circle
# Nature's patterns
# crysanthus@gmail.com
# 16/7/2019

from graphics import *  # depends Tkinter / tkinter
import math
import time

winsz = 700  # size of the window
sx, sy, cx, cy = winsz, winsz, winsz/2, winsz/2
r = int((winsz/2)-10)  # radius of circle
npts = 360  # points on circle
maxtbl = 100  # multiplication tables from 0 ... ?
pt = []  # to hold Points table on circle

win = GraphWin('Multiplication Table Points On Circle', sx, sy)

# radius
Text(Point(15, 20), "Enter Radius -").draw(win)
ier = Entry(Point(110, 20), 5)
ier.setText(r)
ier.draw(win)

# nos points on circle
Text(Point(225, 20), "Nos Points -").draw(win)
iep = Entry(Point(300, 20), 5)
iep.setText(npts)
iep.draw(win)

# table
Text(Point(400, 20), "Table -").draw(win)
iet = Entry(Point(475, 20), 5)
iet.setText(maxtbl)
iet.draw(win)

Text(Point(168, 50), "Fill params, Click mouse on window to start ...").draw(win)

win.getMouse()

# read all 3 inputs
r = int(ier.getText())
npts = int(iep.getText())
maxtbl = int(iet.getText())+1

win.close()  # close input window

# generate points on circle
for x in range(0, npts):
 pt.append(Point((math.cos(2*math.pi/npts*x)*r)+cx, (math.sin(2*math.pi/npts*x)*r)+cy))
 
# table
for tbl in range(0, maxtbl):
 
 win = GraphWin('Multiplication Table Points On Circle x' + str(tbl), sx, sy, autoflush=False)
 
 # draw lines from point to point
 for i in range(0, npts):
  loc = tbl*i if (tbl*i) < npts else (tbl*i)-npts*int((tbl*i/npts))
  ln = Line(pt[i], pt[loc])
  
  color = "red" if i % 3 == 0 else 'blue' if i % 2 == 0 else 'green'
  ln.setOutline(color)
  ln.draw(win)
  
  akey = win.checkKey()
  if akey == "Escape":
   break
 
 update()
 time.sleep(1)
 win.close()
 
 if akey == "Escape":
  break
# EOF

Some interesting patterns emerged,


Monday, September 4, 2017

Arduino based simple weather station with web interface

... an IoT idea,

To build a device and a web interface to sense, store and display an environmental data ...

Here is the idea …
  • Design a device to capture some environmental data,
    • Sensor to report humidity and temperature
    • Sensor to report ambient light
    • Catch them every 2 minutes approx., (or any interval)
    • Send the captured data to cloud for recording and reporting
  • Design a web service,
    • A simple web API to receive and store data
    • A simple process to plot captured data as a graph 
    • A web page to display the graph

What you need,
  • Sensors
  • Ambient light level sensor
  • Internet connectivity
  • Micro-controller to connect all these
    • Arduino UNO – what I used here
      • https://store.arduino.cc/usa/arduino-uno-rev3
      • … and some jumper cables to connect 
      • … and an Arduino C program to capture and send data
  • A cloud based web server
    • Google compute cloud server is used for this
    • A web app to capture data – Python Flask app
      • A POST request is the ideal method (... could not get it to work :( )
      • A GET method worked, thus implemented it …
    • A web app to represent captured data – same app above …

Idea envisioned on a Frtizing design,

Wire the Arduino and related circuit on a breadboard like this. Arduino board's own 3.3v is used for BH1750 light sensor. We need a high amperage 3.3v supply to ESP 8266 WiFi module. That is why KIA78R33 a 3.3v voltage regulator is used to power the ESP. BHT11 sensor can take 5v directly from Arduino.

Idea materialized,


Real time data,


Code … ‘the fun begins here ...',

Code and explanation,

First the Arduino C code,

  1
  2
  3
  4
  5
  6
  7
  8
  9
 10
 11
 12
 13
 14
 15
 16
 17
 18
 19
 20
 21
 22
 23
 24
 25
 26
 27
 28
 29
 30
 31
 32
 33
 34
 35
 36
 37
 38
 39
 40
 41
 42
 43
 44
 45
 46
 47
 48
 49
 50
 51
 52
 53
 54
 55
 56
 57
 58
 59
 60
 61
 62
 63
 64
 65
 66
 67
 68
 69
 70
 71
 72
 73
 74
 75
 76
 77
 78
 79
 80
 81
 82
 83
 84
 85
 86
 87
 88
 89
 90
 91
 92
 93
 94
 95
 96
 97
 98
 99
100
101
102
103
104
105
106
107
108
109
110
111
112
113
114
115
116
117
118
119
120
121
122
123
124
125
126
127
128
129
130
131
132
133
134
135
136
137
138
139
140
141
142
143
144
145
146
147
148
149
150
151
152
153
154
155
156
157
158
159
160
161
162
163
164
165
166
167
168
169
170
171
172
173
174
175
176
177
178
179
180
181
182
183
184
185
186
187
188
189
190
191
192
193
194
195
196
197
198
199
200
201
202
203
204
205
206
207
208
209
210
211
212
213
214
215
216
217
/*
   Environmental Data Sensing and Storing
   mscs crysanthus@gmail.com
*/
#include <SoftwareSerial.h>
#include <Adafruit_Sensor.h>
#include <DHT.h>
#include <DHT_U.h>
#include <Wire.h>
#include <BH1750FVI.h>

SoftwareSerial homeStatESP(6, 7); // RX, TX // ESP Module

DHT_Unified dhtSensor(2, DHT11); /// DHT sensor

BH1750FVI bhLightSensor; // BH1750 Ambient Light Sensor
/*
  sensor connected
  VCC >>> 3.3V
  SDA >>> A4
  SCL >>> A5
  addr >> A3
  Gnd >>>Gnd
*/

uint32_t delayMS;

String asSensorData[3];

// SendCommand prototype
boolean SendCommand(String sATCmd, String sResponse, boolean bCRLF = true);

void setup()
{
  Serial.begin(9600);

  homeStatESP.begin(115200);

  /* --- SENSORS
  */
  // dht sensor
  dhtSensor.begin();

  sensor_t sensor;
  delayMS = sensor.min_delay / 1000;

  // light sensor
  bhLightSensor.begin();
  bhLightSensor.SetAddress(Device_Address_H);//Address 0x5C
  bhLightSensor.SetMode(Continuous_H_resolution_Mode);

  // coonect to ap
  while (!JoinAP());

}

void loop() {

  // Get Temp
  sensors_event_t event;
  dhtSensor.temperature().getEvent(&event);
  if (isnan(event.temperature)) {
    Serial.println("Error reading temperature!");
  }
  else {
    asSensorData[0] = (String)int(event.temperature);
  }

  // Get Humd
  dhtSensor.humidity().getEvent(&event);
  if (isnan(event.relative_humidity)) {
    Serial.println("Error reading humidity!");
  }
  else {
    asSensorData[1] = (String)int(event.relative_humidity);
  }

  // Get Lux / Lumn
  uint16_t lux = bhLightSensor.GetLightIntensity();
  asSensorData[2] = (String)int(lux);

  Serial.println(asSensorData[0] + "*C - " + asSensorData[1] + "% - " + asSensorData[2] + "lux");

  PostData(asSensorData);

  // Delay between measurements.
  delay(60000);
}

/*
   ESP Init
*/
void StartESP() {
  Serial.println("ESP init!");
  SendCommand("AT+RST", "OK");
}

/*
   AT Commander
*/
boolean SendCommand(String sATCmd, String sResponse, boolean bCRLF = true) {
  Serial.println("CMD rcvd!");
  Serial.println(sATCmd);
  bCRLF ? homeStatESP.println(sATCmd) : homeStatESP.print(sATCmd);
  delay(8000);
  return responseFind(sResponse); // find given response
}

/*
   AT Response find
*/
boolean responseFind(String sKey) {

  long lTO = millis() + 5000; // Time Out

  char cKey[sKey.length()];
  sKey.toCharArray(cKey, sKey.length());

  while (millis() < lTO) {

    if (homeStatESP.available()) {

      if (homeStatESP.find(cKey)) {
        Serial.println(sKey);
        return true;
      }
    }
  }

  return false; // timeout
}

boolean JoinAP() {
  Serial.println("Joining AP ...");

  String sAP = "AP NAME";
  String sPP = "AP PASSWORD";

  StartESP();

  if (SendCommand("AT+CWJAP=\"" + sAP + "\",\"" + sPP + "\"", "OK")) {
    Serial.println("Joined AP!");
    return true;
  }
  else {
    Serial.println("Failed joining AP ...");
    return false;
  }

}

/*
   Post to Web API
   a Python Flask API waiting for data
*/
void PostData(String saData[]) {

  String sServer = "WEB SERVER IP OR NAME"; // Without http part
  String sPort = "5000";
  String sURI = "/api/addstatsg?";

  if (SendCommand("AT+CIPSTART=\"TCP\",\"" + sServer + "\"," + sPort, "OK")) {
    Serial.println("TCP connection ready!");

    /**
       HTTP GET Sample
       GET /api/addstatsg?cert=xyz&amp;temp=34&amp;humd=45&amp;lumn=55 HTTP/1.1
       Host: 192.168.1.5:5000
    */
    String sPostRequest =  String("GET " + sURI);
            sPostRequest += String("cert=xyz&");
            sPostRequest += String("temp=" + saData[0] + "&");
            sPostRequest += String("humd=" + saData[1] + "&");
            sPostRequest += String("lumn=" + saData[2] + " HTTP/1.1\r\n");
            sPostRequest += String("Host: " + sServer + ":" + sPort + "\r\n\r\n"); // ends with 2 x CRLF - Important -
    /*
       This is by AT design
    */
    SendCommand("AT+CIPSEND=", "", false);
    if (SendCommand(String(sPostRequest.length()), ">")) {
      Serial.println("TCP ready to receive data ...");

      if (SendCommand(sPostRequest, "SEND OK")) {
        Serial.println("Data packets sent ok!");

        while (homeStatESP.available()) {
          Serial.println(homeStatESP.readString());
        }
        // close the connection
        CloseTCPConnection();
      }
      else {
        CloseTCPConnection();
      }
    }
    else {
      CloseTCPConnection();
    }
  } else {
    CloseTCPConnection();
  }
}

/*
   Close TCP connection
*/
void CloseTCPConnection() {

  while (!SendCommand("AT+CIPCLOSE", "OK")) {
    Serial.print(".");
  }
  Serial.println("TCP connection closed!");
}

/*
   EOF
*/

  1. Upload this code to Arduino UNO
  2. Replace the following with your own settings - your own WiFi SSID / Access Point name and password
  3. Web server IP or name without the http:// part. Can change the port but the same port number must be in the python code too in line 162 

  String sAP = "AP NAME";
  String sPP = "AP PASSWORD";

  String sServer = "WEB SERVER IP OR NAME"; // Without http part
  String sPort = "5000";
  String sURI = "/api/addstatsg?";

Once successful, remove all the Serial.println statements to save some space in Arduino.

And the python code,

... this code need three major libs from python - matplotlib, flask, gevent

  1
  2
  3
  4
  5
  6
  7
  8
  9
 10
 11
 12
 13
 14
 15
 16
 17
 18
 19
 20
 21
 22
 23
 24
 25
 26
 27
 28
 29
 30
 31
 32
 33
 34
 35
 36
 37
 38
 39
 40
 41
 42
 43
 44
 45
 46
 47
 48
 49
 50
 51
 52
 53
 54
 55
 56
 57
 58
 59
 60
 61
 62
 63
 64
 65
 66
 67
 68
 69
 70
 71
 72
 73
 74
 75
 76
 77
 78
 79
 80
 81
 82
 83
 84
 85
 86
 87
 88
 89
 90
 91
 92
 93
 94
 95
 96
 97
 98
 99
100
101
102
103
104
105
106
107
108
109
110
111
112
113
114
115
116
117
118
119
120
121
122
123
124
125
126
127
128
129
130
131
132
133
134
135
136
137
138
139
140
141
142
143
144
145
146
147
148
149
150
151
152
153
154
155
156
157
158
159
160
161
162
163
#!flask/bin/python
#
# Environmental Data Sensing and Storing 
# mscs crysanthus@gmail.com
#
import datetime

from flask import Flask, abort, request, make_response, jsonify, render_template, send_from_directory

# db
import sqlite3

# graph
import matplotlib
matplotlib.use('Agg')
import matplotlib.pyplot as plt

 
# WSGI Server
from gevent.wsgi import WSGIServer

# create db and table in init case
try:
 conn = sqlite3.connect('homestats.db')
 cursr = conn.cursor()
 cursr.execute('''CREATE TABLE IF NOT EXISTS weather_data
  (iid integer primary key, date text, temp text, humd text, lumn text)''') 
 conn.commit()

except:
 abort(500)

app = Flask(__name__, static_url_path='')

# serve images directly, no process
@app.route('/favicon.ico')
def send_favicon():
    return send_from_directory('templates/images', 'favicon.ico')

# serve images directly, no process
@app.route('/images/<path:path>')
def send_images(path):
    return send_from_directory('templates/images', path)
    
# serve graph directly, no process
@app.route('/graphs/<path:path>')
def send_graphs(path):
    return send_from_directory('templates/graphs', path)

# save data
# save GET data -- working part --
@app.route('/api/addstatsg', methods=['GET'])
def add_stats_get():

 try:
  # check to see if API token is correct -- TODO --
  if not request.args['cert']:
   abort(417)
 
  if request.args['cert'] != 'xyz':
    abort(417)
  # check to see if API token is correct -- TODO --
  
  # chk to see if the field have correct values
  if not request.args['temp'] or not request.args['temp'].isnumeric():
   abort(404)

  if not request.args['humd'] or not request.args['humd'].isnumeric():
   abort(404)

  if not request.args['lumn'] or not request.args['lumn'].isnumeric():
   abort(404)
 
  stats = {'date': datetime.datetime.now().strftime('%Y-%m-%d %H:%M:%S'),
   'temp': request.args['temp'],
   'humd': request.args['humd'],
   'lumn': request.args['lumn']
   }

 except:
  abort(501)
 
 try:
  conn = sqlite3.connect('homestats.db')
  cursr = conn.cursor()

  cursr.execute('''INSERT INTO weather_data 
   VALUES(NULL, :date, :temp, :humd, :lumn)''', stats)
  conn.commit()
  
 except:
  abort(500)

 return jsonify({'homestats':'data saved'}), 201


# create graph and serve stat html
@app.route('/')
def index():

 # do the graph
 plt.ylabel('Units')
 plt.xlabel('Date/Time')
 
 # get data
 conn = sqlite3.connect('homestats.db')
 cursr = conn.cursor()
 cursr.execute('''SELECT date, temp, humd, lumn FROM weather_data;''')
 xv = [] # x axis
 yv1 = [] # y axis - tempreture in red
 yv2 = [] # y axis - humidity in green
 yv3 = [] # y axis - ambient light in yellow
 
  # add data to graph
 for row in cursr:
  xv.append(datetime.datetime.strptime(row[0],"%Y-%m-%d %H:%M:%S"))
  yv1.append(myFloat(row[1]))
  yv2.append(myFloat(row[2]))
  yv3.append(myFloat(row[3]))

 # legends
 plt.plot(xv, yv1, '-r', label='Tempreture', linewidth=0.50)
 plt.plot(xv, yv2, '-g', label='Humidity', linewidth=0.75)
 plt.plot(xv, yv3, '-y', label='Light', linewidth=0.80)
 # beautify the x-labels
 plt.gcf().autofmt_xdate()
 plt.legend()
 
 # save graph as a .png file to serve via html
 plt.savefig('templates/graphs/statistic.png')
 plt.close()
 
 # -- send html out with graph --
 return render_template('stats.html')

# http errors
@app.errorhandler(404)
def not_found(error):
    return make_response(jsonify({'error': 'Not found'}), 404)

@app.errorhandler(500)
def not_found(error):
    return make_response(jsonify({'error': 'Server Internal error'}), 500)

@app.errorhandler(501)
def not_found(error):
    return make_response(jsonify({'error': 'Not Implemented'}), 501)

@app.errorhandler(417)
def not_found(error):
    return make_response(jsonify({'error': 'Token error'}), 417)

# chk to see if a string is float-able
def myFloat(s):
    try:
        return float(s)
    except ValueError:
        return 0.0

if __name__ == '__main__':
    http_server = WSGIServer(('0.0.0.0', 5000), app)
    http_server.serve_forever()
 

Hosting,
I set up a tiny Google cloud server with Ubuntu Linux 16.04 server to host this app. Need to do the following to add python dependencies. Need to have shell access to the server to do the following,
  1. Update and upgrade Ubuntu and install GCC compiler
  2. 1
    2
    3
    sudo apt update
    sudo apt upgrade
    sudo apt install gcc
  3. Install python tools
  4. 1
    2
    3
    sudo apt install python-dev
    sudo apt install python-virtualenv 
    sudo apt install python-pip
    
  5. Create app folders
  6. 1
    2
    3
    mkdir homestat
    cd homestat
    mkdir -p templates/{images,graphs}
    
  7. Create python flask environment
  8. Get inside flask environment
  9. Add dependencies to run web app
  10. 1
    2
    3
    4
    5
    virtualenv flask
    source flask/bin/activate
    pip install flask
    pip install matplotlib
    pip install gevent
    
  11. Create a HTML file called stats.html in homestats/flask/templates/ folder and copy the content below
  12. <!DOCTYPE HTML PUBLIC "-//W3C//DTD HTML 4.0 Transitional//EN">
    <html>
    <head>
     <meta http-equiv="content-type" content="text/html; charset=utf-8"/>
     <title>Home Stats</title>
     <style type="text/css">
      @page { margin: 0.79in }
      p { margin-bottom: 0.1in; line-height: 120% }
      img { display: block; margin: 0 auto;}
     </style>
    </head>
    <body lang="en-US" dir="ltr">
     <p align="center" style="margin-bottom: 0.25in; line-height: 100%">Home Stats</p>
     <img src="images/building-statistics.jpg" alt="building-statistics"/>
     <hr/>
     <img id="graph" src="graphs/statistic.png" alt="home-statistics"/>
     <script language="javascript" type="text/javascript">
          var d = new Date(); 
          document.getElementById("graph").src="graphs/statistic.png?ver="+d.getTime();
     </script>
    </body>
    </html>
    
  13. Upload a small graphic logo in homestats/flask/templates/images/ folder to be displayed on your web page. Name it building-statistics.jpg
  14. Upload a small favicon.ico in homestats/flask/templates/images/ folder. Not a must but a nice to have.
  15. Copy and paste the above python source code to a file named app.py and save.
  16. This web app is setup to listen to TCP port 5000. In Google cloud firewall rule is required to allow web traffic to port 5000. Goto VPC nework - Firewall rules to setup that.
  17. Run web app
  18. 1
    python ./app.py
    
  19. If everything go well, you must see the HTTP GET calls displayed as follows - which means Arduino is sending data correctly to your web app
  20. And now you can get the python app to create the statistic graph by calling http:<your web server IP>:5000/
  21. tips and tricks - I ran this python app inside a screen tool and close the terminal. It runs as a temporary daemon. Don't CTRL + C and exit. It will terminate the server.
  22. Let me know your success story
  23. The code and concept must be shared and spread!